
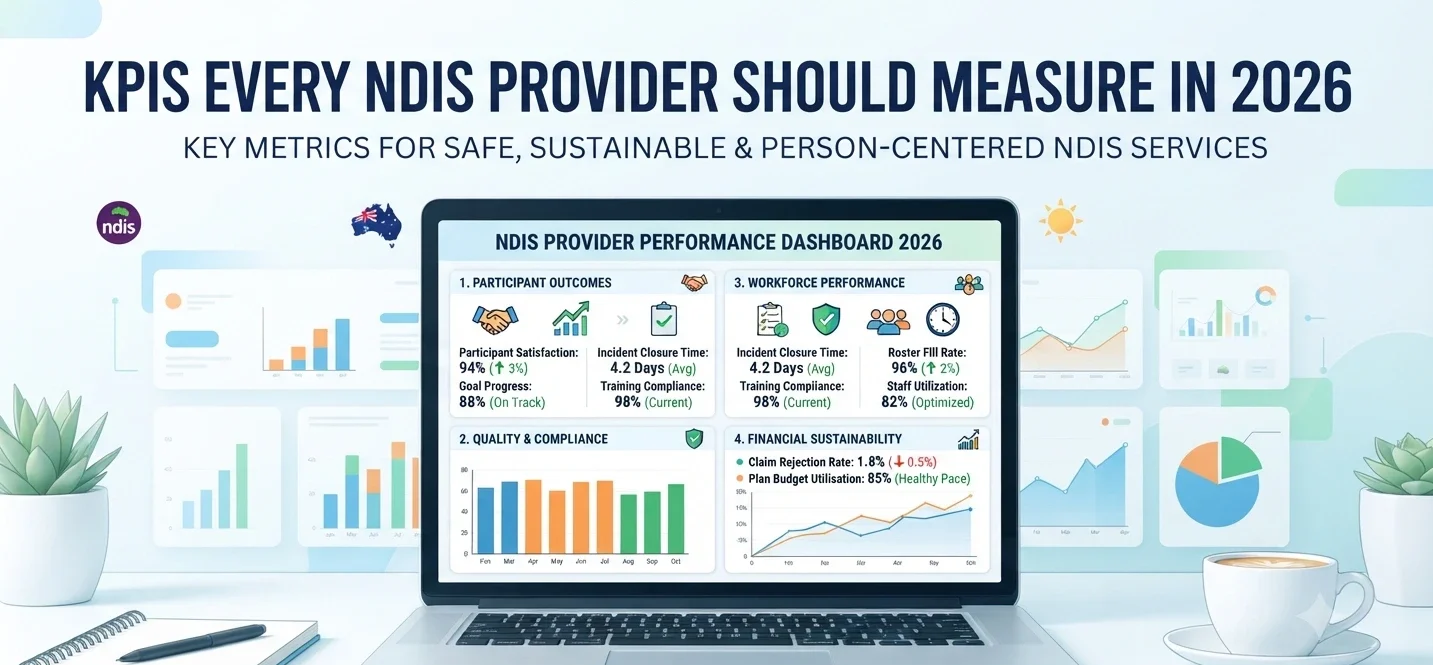
The KPIs Every NDIS Provider Should Measure are the numbers that show whether your services are safe, compliant, financially sustainable and genuinely helping participants.
A strong KPI dashboard should track participant outcomes, incidents, complaints, rostering, workforce performance, claims, cash flow and documentation quality.
The best NDIS Software turns these numbers into simple daily actions, not just end-of-month reports.
Running an NDIS business is no longer just about filling shifts and submitting claims. Providers need to show safe service delivery, strong records, clear governance, responsive complaints handling and sustainable operations.
That pressure is growing. As at 31 March 2026, the NDIS had 774,456 participants with approved plans, and the provider market continued to grow. In the 12 months to 31 March 2026, $50.1 billion in supports was provided across the Scheme. (NDIS)
That means every provider, from a new support business to a larger SIL or allied health organisation, needs better visibility. This guide explains the KPIs every NDIS provider should measure, why each metric matters, how to calculate it, and how NDIS Software can make reporting easier.
KPIs for NDIS providers are measurable indicators that show how well a provider is performing across care quality, compliance, participant outcomes, workforce management and financial health. They help leaders spot risks early, improve services and make better decisions using evidence instead of guesswork.
A KPI is not just a number on a spreadsheet. It should answer a real business or service question.
For example:
| Business question | Useful KPI |
| Are participants receiving consistent support? | Service delivery completion rate |
| Are incidents being handled properly? | Incident closure time |
| Are claims being submitted on time? | Claim submission cycle time |
| Are workers over-stretched? | Overtime rate |
| Are participants happy with support? | Participant satisfaction score |
| Are records audit-ready? | Case note completion rate |
The NDIS Practice Standards set out quality standards for registered providers and include modules for governance, operational management, provision of supports, risk, complaints and incident management. These standards make KPI tracking more than a business improvement tool. For many providers, it is part of building evidence for safe and accountable services. (NDIS Quality and Safeguards Commission)
NDIS providers should measure KPIs because good data helps them improve participant outcomes, reduce compliance risk, control costs, protect cash flow and support staff. Without KPIs, problems often appear too late, such as missed notes, rejected claims, roster gaps, unresolved complaints or poor audit evidence.
The NDIS environment is becoming more data-driven. The NDIA itself tracks participant experience, complaints, contact centre performance, plan budgets, provider payments and market trends in its public reporting. In the March 2026 quarter, the NDIA reported that 86% of complaints were closed within 21 days and 87% of National Contact Centre callers had their enquiries resolved at first contact. (NDIS)
Providers do not need to copy every NDIA metric. But they should learn from the principle: what gets measured can be managed.
Strong KPIs help you:
The 12 core KPIs every NDIS provider should measure first are participant satisfaction, goal progress, service delivery completion, complaint resolution time, incident closure time, case note completion, roster fill rate, staff utilisation, training compliance, claim rejection rate, debtor days and plan budget utilisation.
These are the best starting point because they cover the four areas that matter most:
| KPI | What it shows | Suggested review |
| Participant satisfaction score | Whether participants feel respected and supported | Monthly or quarterly |
| Goal progress rate | Whether supports are helping participants move towards goals | Monthly |
| Service delivery completion rate | Whether booked supports are actually delivered | Weekly |
| Complaint resolution time | How quickly concerns are handled | Weekly or monthly |
| Incident closure time | Whether incidents are investigated and resolved | Weekly |
| Case note completion rate | Whether documentation is current | Daily or weekly |
| Roster fill rate | Whether shifts are covered | Daily |
| Staff utilisation rate | Whether worker time is used well | Weekly |
| Training compliance rate | Whether staff requirements are current | Monthly |
| Claim rejection rate | Whether billing data is accurate | Weekly |
| Debtor days | How long invoices take to be paid | Weekly |
| Plan budget utilisation | Whether participants are using funding appropriately | Monthly |
Do not start with 80 KPIs. Start with 12, make them accurate, then expand.
Participant outcome KPIs show whether your supports are making a real difference in a person’s life. They should measure goal progress, choice and control, satisfaction, service continuity and participant feedback. These KPIs matter because NDIS services should be person-centred, not just schedule-driven.
Participant satisfaction score measures how participants feel about your service. It can be collected through short surveys, phone check-ins, review meetings or digital feedback forms.
Simple formula:
Number of positive responses ÷ total responses × 100
Example questions:
Keep surveys short. A five-question survey every quarter is better than a long annual survey nobody completes.
Goal progress rate shows whether supports are helping participants move towards their NDIS goals.
Simple formula:
Goals with recorded progress ÷ active goals × 100
This KPI works best when goals are written clearly and reviewed often. For example, “increase community participation” should be linked to real activities, such as attending a weekly group, travelling independently, joining a class or building confidence in social settings.
The NDIA reports participant outcome measures such as choice and control, social participation, daily living and community activity in its own longitudinal data. Providers can use a smaller version of this idea inside their own service reviews. (NDIS)
Service delivery completion rate shows how many planned services were actually delivered.
Simple formula:
Completed shifts or appointments ÷ scheduled shifts or appointments × 100
Low completion may point to:
This KPI should be reviewed weekly. For SIL and community access providers, it may need daily review.
Participant retention rate shows how many participants continue using your service over time.
Simple formula:
Participants retained during period ÷ participants at start of period × 100
Retention must be interpreted carefully. A participant leaving is not always bad. They may move, change goals, choose another provider or no longer need the service. The important step is to record the reason.
Track exit reasons such as:
This turns retention into a learning tool, not just a growth metric.
Quality and safeguarding KPIs measure how well a provider identifies, records, manages and learns from risks, incidents and complaints. These KPIs help protect participants and create evidence that the provider is taking safety, dignity and continuous improvement seriously.
The NDIS Commission says incidents that happen during NDIS supports must be identified, assessed, recorded, managed and resolved while keeping the person with disability safe, respected and informed. It also says all NDIS providers should have an incident management system. (NDIS Quality and Safeguards Commission)
Incident rate helps providers understand whether safety issues are increasing or decreasing compared with service volume.
Simple formula:
Number of incidents ÷ total support hours × 1,000
This is better than counting incidents alone. A provider delivering 20,000 hours of support will naturally record more incidents than a provider delivering 500 hours.
Track incident types separately:
A rise in incident reporting is not always bad. It may mean staff are becoming more confident in reporting. The key question is whether incidents are reviewed and used to improve practice.
Registered providers must notify the NDIS Commission of reportable incidents. This KPI measures whether reportable incidents are identified and escalated within required timeframes. (NDIS Quality and Safeguards Commission)
Simple formula:
Reportable incidents submitted on time ÷ total reportable incidents × 100
This KPI should be monitored closely by managers, especially in higher-risk services.
Useful dashboard fields include:
Incident closure time measures how long it takes to investigate, document, resolve and review incidents.
Simple formula:
Average days from incident report to closure
Do not use this KPI to rush serious investigations. Instead, split incidents by severity.
For example:
| Incident level | Review expectation |
| Low risk | Quick review and local action |
| Medium risk | Manager review and documented follow-up |
| High risk | Formal investigation, escalation and governance review |
| Reportable | Commission notification and strict internal tracking |
Complaint resolution time measures how quickly your organisation responds to and resolves complaints.
The NDIS Commission says the NDIS Code of Conduct requires providers to promptly take action when someone raises a concern or complaint about the quality and safety of supports. (NDIS Quality and Safeguards Commission)
Simple formula:
Average days from complaint received to complaint closed
Track:
A complaint is not just negative feedback. It can show where systems, communication or staff training need improvement.
Compliance KPIs show whether your records, worker checks, policies, training, service agreements and participant documents are current. They help providers avoid last-minute audit stress and support safer daily operations.
The NDIS Practice Standards include quality indicators that auditors use to assess compliance. The standards cover modules such as governance, operational management, provision of supports, risk, complaints and incident management. (NDIS Quality and Safeguards Commission)
Case note completion rate shows whether workers are recording support delivery on time.
Simple formula:
Completed case notes ÷ completed shifts × 100
Also track case note lag.
Case note lag formula:
Average time between shift completion and note submission
For many providers, this is one of the most important KPIs. Late notes can affect:
A good NDIS Software system should let field staff add notes from mobile devices, not wait until they return to the office.
Service agreement currency shows whether participants have current agreements linked to the supports being delivered.
Simple formula:
Participants with current service agreements ÷ active participants × 100
Track agreement expiry, funding categories, service dates and agreed pricing. Pricing must be discussed and agreed with participants when changes are proposed. The NDIS pricing schedule sets out guidance on appropriate and reasonable maximum prices for NDIS supports. (NDIS)
This KPI shows whether staff checks, licences, qualifications and role requirements are current.
Simple formula:
Workers with all required credentials current ÷ active workers × 100
Track expiry dates for:
This KPI should trigger automatic alerts before expiry, not after.
Training completion rate shows whether workers have completed required induction and refresher training.
Simple formula:
Completed required training modules ÷ assigned training modules × 100
The NDIS Commission provides worker training modules, including the Worker Orientation Module: Quality, Safety and You, which explains worker obligations under the NDIS Code of Conduct. (NDIS Quality and Safeguards Commission)
Training KPIs should be filtered by team, role and service type. A support worker delivering high intensity supports may need different training from an admin worker or support coordinator.
Workforce KPIs show whether you have the right people, in the right place, at the right time. They help providers reduce missed supports, overtime, burnout and poor participant-worker matching.
Roster fill rate shows how many required shifts are assigned to suitable workers.
Simple formula:
Filled shifts ÷ total required shifts × 100
Track this by:
A low roster fill rate may mean your team needs more casual staff, better availability data or earlier scheduling.
Shift acceptance rate shows how often workers accept offered shifts.
Simple formula:
Accepted shifts ÷ offered shifts × 100
Low acceptance may point to:
This KPI helps managers understand workforce behaviour before shifts become urgent problems.
Staff utilisation rate shows how much paid worker time is spent delivering billable or productive service.
Simple formula:
Direct support hours ÷ total paid hours × 100
This KPI must be used fairly. A provider still needs supervision, training, documentation, travel and team meetings. The goal is not to make every minute billable. The goal is to understand where time is going.
This KPI shows whether your workforce model is under pressure.
Track:
If overtime keeps rising, the issue may not be staff effort. It may be poor workforce planning, weak forecasting or unsustainable service growth.
Worker turnover rate shows how many staff leave during a period.
Simple formula:
Number of staff departures ÷ average number of staff × 100
Measure voluntary and involuntary turnover separately. Also track turnover by team leader, location, support type and employment type.
High turnover affects:
Financial KPIs show whether services are being claimed, invoiced and paid correctly. They help providers protect cash flow, reduce rejected claims and understand whether growth is sustainable.
In the March 2026 quarter, NDIS payments to active providers totalled $12.4 billion, with 64% managed by plan managers, 27% NDIA-managed and 9% self-managed. (NDIS)
Claim submission cycle time measures how long it takes to submit a claim after service delivery.
Simple formula:
Average days from service delivery to claim submission
A long cycle time can cause cash flow pressure. It can also make errors harder to fix because staff may not remember details weeks later.
Track by:
Claim rejection rate shows how often claims fail or need correction.
Simple formula:
Rejected claims ÷ total submitted claims × 100
Common causes include:
Your NDIS Software should help prevent these errors before submission.
Unbilled services show delivered supports that have not yet been invoiced or claimed.
Simple formula:
Value of delivered but unbilled supports
This KPI should be visible every week. It is one of the fastest ways to find hidden cash flow problems.
Debtor days show how long it takes to collect payment after invoicing.
Simple formula:
Accounts receivable ÷ average daily revenue
Track debtor days separately for:
If debtor days rise, review invoice accuracy, follow-up process, plan manager communication and participant billing details.
Plan budget utilisation shows whether participants are using funding at a healthy pace.
Simple formula:
Used budget ÷ available budget × 100
This KPI supports better planning. Underuse may mean supports are not being delivered. Overuse may mean the plan could run out early.
Plan utilisation should never be used to push unnecessary services. It should help providers and participants plan supports responsibly.
Operational productivity KPIs show how much time your team spends on admin, rework and manual processes. They help providers find the hidden costs of spreadsheets, duplicated data entry and disconnected tools.
LinkedIn discussions in the NDIS software space highlight a common sector issue: many providers still rely on spreadsheets, paper forms and separate tools for rostering, incidents, service agreements and billing. Each handover between systems can create errors, missing invoices, lost notes and compliance gaps. (LinkedIn)
Admin hours per participant shows how much back-office time is required to support each participant.
Simple formula:
Total admin hours ÷ active participants
Track admin time spent on:
If this KPI rises as you grow, your systems may not be scaling.
Duplicate data entry rate shows how often staff enter the same information into multiple systems.
This is harder to calculate, but it can be measured through workflow audits.
For example:
| Task | Entered once? | Entered multiple times? |
| Participant profile | Yes | No |
| Shift details | No | Yes, roster and invoice sheet |
| Incident record | No | Yes, paper form and spreadsheet |
| Case note | Yes | No |
| Claim data | No | Yes, billing file and portal |
The aim is simple: enter data once, then use it across rostering, notes, billing and reporting.
Dashboard review completion measures whether managers are actually reviewing KPIs.
Simple formula:
Completed KPI reviews ÷ scheduled KPI reviews × 100
A dashboard has no value if nobody uses it. Assign a review rhythm:
Small NDIS providers should track fewer KPIs but review them more often. The best starter set includes roster fill rate, case note completion, incident closure, complaint resolution, claim rejection rate, unbilled services, participant satisfaction and worker credential expiry.
Small providers often feel they do not have enough data for advanced reporting. That is fine. Start with simple operational KPIs.
A practical small-provider dashboard could include:
| KPI | Why it matters |
| Roster fill rate | Prevents missed supports |
| Case note completion | Keeps records current |
| Incident closure | Supports safety and compliance |
| Complaint resolution | Protects trust |
| Claim rejection rate | Reduces payment delays |
| Unbilled services | Protects cash flow |
| Worker credential expiry | Reduces compliance risk |
| Participant satisfaction | Shows service quality |
For new providers, these numbers are enough to build good habits early.
Larger NDIS providers should track KPIs by team, region, service type, participant group and manager. They need stronger dashboards for workforce capacity, SIL performance, incident trends, claims, compliance, participant outcomes and governance reporting.
Large providers should add:
The bigger the provider, the more important segmentation becomes. A company-wide average can hide serious local problems.
NDIS Software helps providers track KPIs by connecting rosters, participant records, case notes, incidents, billing, staff details and reports in one system. This reduces manual entry, improves visibility and gives managers faster access to the data they need.
Ausvanta describes itself as an all-in-one NDIS software platform for Australian providers, with features for rostering, case notes, incident reporting, claiming and invoicing. It also states that the platform is hosted in Australia. (Ausvanta)
Good NDIS Software should help you:
The goal is not just automation. The goal is better decisions.
The best KPI dashboard for NDIS providers should show urgent risks first, then weekly operations, monthly trends and quarterly governance insights. It should be simple enough for managers to use without needing a data analyst.
Recommended layout:
| Dashboard section | KPIs to show |
| Today’s risks | Unfilled shifts, urgent incidents, overdue case notes |
| Service quality | Satisfaction, complaints, goal progress, service completion |
| Compliance | Expiring credentials, training, service agreements, audit actions |
| Workforce | Roster fill, utilisation, overtime, turnover |
| Finance | Claim rejection, debtor days, unbilled services, budget use |
| Governance | Monthly trends, risk heatmap, improvement actions |
Use colour carefully. Red should mean action is needed now. If everything is red, nothing stands out.
The most common KPI mistakes are tracking too many numbers, using vanity metrics, ignoring data quality, blaming staff without reviewing systems and failing to connect KPIs to participant outcomes. KPIs should guide improvement, not create fear.
Avoid these mistakes:
To set up KPI tracking, choose your core metrics, define each formula, clean your data, assign KPI owners, build a dashboard, review results weekly and use findings to improve services. Keep the first version simple and improve it over time.
Start with:
For each KPI, document:
Check whether your records are complete.
Review:
Start with a dashboard that managers can understand in five minutes.
Include:
A weekly KPI meeting should answer:
Do not stop at reporting. Use KPIs to improve:
A good KPI benchmark depends on provider size, service type, participant needs, risk level and maturity. There is no single universal target for every NDIS provider. Start with your own baseline, then set realistic improvement targets.
For example:
| KPI | Starter target idea |
| Case note completion | Improve month by month until late notes are rare |
| Claim rejection rate | Reduce avoidable rejections steadily |
| Complaint acknowledgement | Same or next business day where practical |
| Training compliance | Keep required training current |
| Roster fill rate | Review daily and reduce last-minute gaps |
| Incident closure | Track by severity, not one blanket target |
| Participant satisfaction | Improve themes, not just score |
Benchmarks should never encourage unsafe behaviour. For example, do not set an incident target that makes workers afraid to report incidents.
The KPIs Every NDIS Provider Should Measure are not just business numbers. They are signals of safety, trust, quality, compliance and sustainability.
Start with the basics. Track participant satisfaction, goal progress, service delivery, complaints, incidents, case notes, rosters, training, claims and cash flow. Then build a dashboard that helps your team act early.
For providers using spreadsheets or disconnected tools, NDIS Software can make this work far easier. Ausvanta brings key NDIS workflows into one platform, including rostering, case notes, incident reporting, claiming and invoicing, so providers can spend less time chasing data and more time improving services. (Ausvanta)
A better KPI system will not replace good leadership. But it will give leaders the visibility they need to run safer, stronger and more sustainable NDIS services.
The most important KPIs are participant satisfaction, goal progress, service delivery completion, complaint resolution time, incident closure time, case note completion, roster fill rate, staff utilisation, training compliance, claim rejection rate, debtor days and plan budget utilisation.
KPIs help NDIS providers measure service quality, safety, compliance, workforce performance and cash flow. They also help managers spot risks early and make better decisions based on real data.
A good dashboard shows urgent risks, service quality, compliance, workforce, finance and governance metrics. It should be simple, current and easy for managers to review each week.
Urgent KPIs such as roster gaps and incidents should be reviewed daily. Claims, case notes and complaints should be reviewed weekly. Training, satisfaction and governance trends can be reviewed monthly or quarterly.
Useful compliance KPIs include case note completion, incident closure time, reportable incident timeliness, complaint resolution time, training completion, worker credential currency, service agreement currency and audit action closure.
NDIS providers should track claim submission cycle time, claim rejection rate, unbilled services, debtor days, plan budget utilisation, revenue by service type and gross margin by program.
Important workforce KPIs include roster fill rate, shift acceptance rate, staff utilisation, overtime, agency reliance, worker turnover, absenteeism and training compliance.
Providers should measure participant satisfaction, goal progress, service continuity, complaint themes, choice and control feedback, support cancellation trends and participant retention reasons.
Yes. Small providers can start with a basic dashboard. However, as they grow, NDIS Software can reduce manual work and improve accuracy by linking rosters, notes, incidents and billing.
NDIS Software helps by centralising participant records, rosters, staff data, case notes, incidents, claims and invoices. This makes KPI reporting faster and reduces duplicate data entry.
A metric is any number you track. A KPI is a key number linked to an important goal, such as safer services, better participant outcomes, stronger compliance or improved cash flow.
Yes, but targets should be realistic and based on service type, provider size and risk level. Start with your current baseline, then set improvement goals.
Case note completion is one of the best first KPIs because it affects service continuity, compliance evidence, incident follow-up and billing confidence.
Yes. KPIs can help providers maintain current records, track training, monitor incidents, close complaints and show evidence of continuous improvement.
Most providers should start with 10 to 12 core KPIs. Larger providers can expand to 25 or more once data quality and reporting habits are strong.
Start your free 14-day trial — unlimited users, no credit card required.